Illustration: Dom Guzman / Crunchbase News
2025: more dollars, narrower distribution
A high annual total coexisted with extraordinary AI and megadeal concentration.
Follow the venture cycle. Decode the deal.
Understand what the headline leaves out.
Six years. Several different markets.
2025 · $425B · Report dated 7 Jan 2026
Pick a year to inspect the reading.
Annual report snapshots, with dated revisions at the data desk.
01 / The research desk
A high annual total coexisted with extraordinary AI and megadeal concentration.
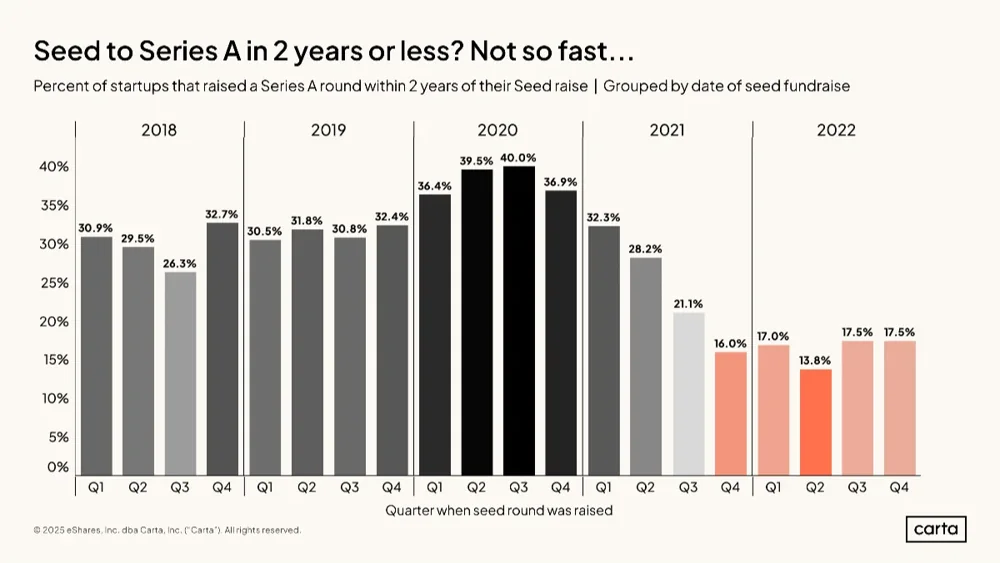
A two-year cohort metric reveals a tighter path after the boom.
More exit value did not erase the backlog of private companies.
Cycle explorer / Crunchbase global
Choose a year to keep the annual value, report date and later cited revision in view together.
Annual funding / 2020
$300B
Pandemic-era resilience did not make the year comparable with the boom that followed.
2020: venture held its footingAnnual funding / 2021
$643B
The peak is a report-time snapshot; retain its original scope and date when using it.
2021: the record breaksAnnual funding / 2022
$445B
The reset began before a later citation revised the historical total upward.
2022: the reset reaches late stageAnnual funding / 2023
$285B
A lower annual total describes funding in the report’s population, not every private-market outcome.
2023: less capital at every stageAnnual funding / 2024
$314B
The recovery was uneven; this annual value should travel with its Crunchbase coverage boundary.
2024: recovery with a split by stageAnnual funding / 2025
$425B
A larger annual total does not settle questions of participation, concentration or liquidity.
2025: more dollars, narrower distributionRead each annual report:
2020 · $300B ↗2021 · $643B ↗2022 · $445B ↗2023 · $285B ↗2024 · $314B ↗2025 · $425B ↗02 / Different markets. Different stories.
Partech counted a widening deal market and a shrinking capital total in the same pandemic year.
A sector-specific record shows how far the venture boom reached beyond general software.
A large listing year became a dated case study in how quickly private exit values can reprice.
03 / Open the evidence
Original charts, report pages and publisher artwork. Explore the visual record behind the research, with the credits kept close.
Enter the visual library ↗
04 / The ownership lab
The Venture Trace standard
The provider. The period. The population.
The small details that change the big picture.